


Trends Analysis of the Israeli market for new vehicles - Q2 2024
August 8, 2024
Registration Data
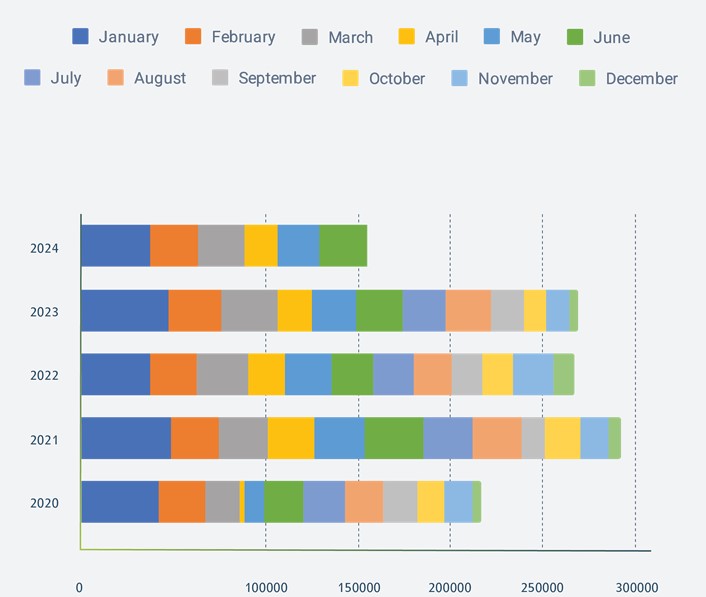
Registration by Engine Type
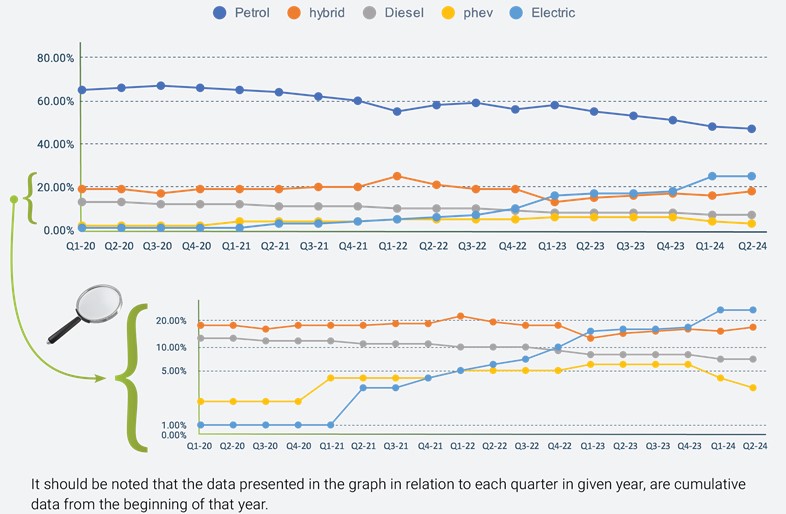
In Q2 2024, Petrol vehicles saw their market share further decline to 47%, a continuation of the downward trend from 48% in Q1 2024. This steady decrease from higher previous figures, including 55% in Q2 2023 and 64% in Q2 2022, underscores the ongoing shift away from petrol-powered vehicles as consumer preferences evolve towards more environmentally friendly alternatives.
Electric vehicles maintained a strong presence, holding 25% of the market share in Q2 2024, consistent with Q1 2024. This stability follows a significant increase from earlier figures, where electric vehicles only accounted for 17% in Q2 2023 and a mere 6% in Q2 2022. This reflects a rapid adoption rate and a robust consumer shift towards electric vehicles.
Hybrid vehicles increased their market share to 18% in Q2 2024, up from 16% in Q1 2024. Though this represents a recovery from recent figures, it remains below the 21% seen in Q1 2022, indicating that hybrids, while still popular, haven't fully regained their peak market presence from two years ago.
Registration by Segment Type
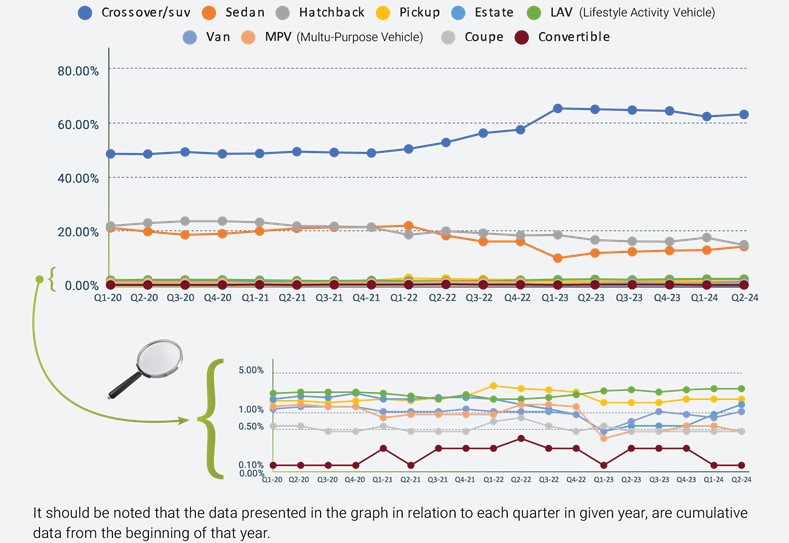
In Q2 2024, the Israeli automotive market displayed nuanced changes across vehicle segments:
Crossover/SUV segment continued to hold a strong position with 63.7% of the market, slightly up from 62.9% in Q1 2024. This represents an increase from the previous quarter but still falls below the 65.6% observed in Q2 2023, indicating some fluctuation yet maintaining a dominant presence compared to 53.2% in Q2 2022.
Sedan segment saw a marginal increase to 14.4%, up from 13.1% in Q1 2024. While this shows improvement, it is still down from the 18.5% share in Q2 2022 and notably lower than the 21.2% in Q2 2021, reflecting a gradual but persistent decline in sedan popularity amid the growing preference for SUVs.
Hatchback segment saw its market share at 15.1%, down from 17.8% in Q1 2024. Despite this quarter-to-quarter decline, hatchbacks have shown relative stability, close to 16.9% in Q2 2023, the numbers indicate ongoing consumer interest but also points to a gradual downward trend in hatchback popularity.
Registration by Category
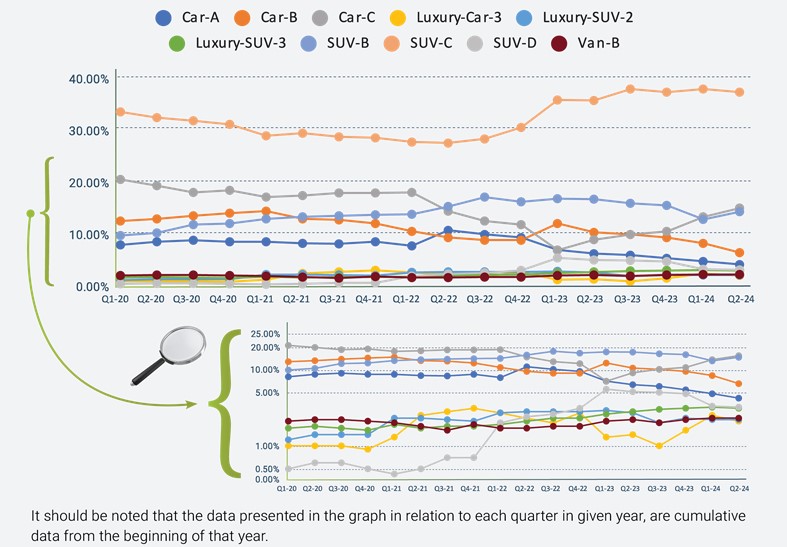
SUV-C category maintained its market dominance with 37.4%, a slight decrease from 38.0% in Q1 2024 but still showing robust appeal compared to 35.8% in Q2 2023 and a substantial growth from 27.6% in Q2 2022.
SUV-B category increased to 14.4%, up from 12.9% in Q1 2024, demonstrating a recovery from the previous quarter. However, this still represents a decrease from 16.8% in Q2 2023 and from 15.4% in Q1 2022, indicating some fluctuation but generally a slight decline in consumer interest for mid-sized SUVs over the past year.
Car-C category saw a notable increase to 15.1% in Q2 2024, up from 13.4% in Q1 2024. This marks a significant recovery from 9% in Q2 2023, and it even surpasses the 14.5% observed in Q2 2022. This upward trend indicates a resurgence in popularity for the Car-C segment, suggesting that consumer interest in this category may be rebounding after a previous year's dip.
Car-B category continued to see a decline in market share, registering at 6.5% in Q2 2024, down from 8.3% in Q1 2024. This represents a continuation of a declining trend from 10.4% in Q2 2023 and further down from 9.4% in Q2 2022. This sustained decrease over multiple quarters highlights a drop in consumer interest in the Car-B segment, reflecting a broader market shift away from smaller vehicle categories.
Registration by Country of Origin
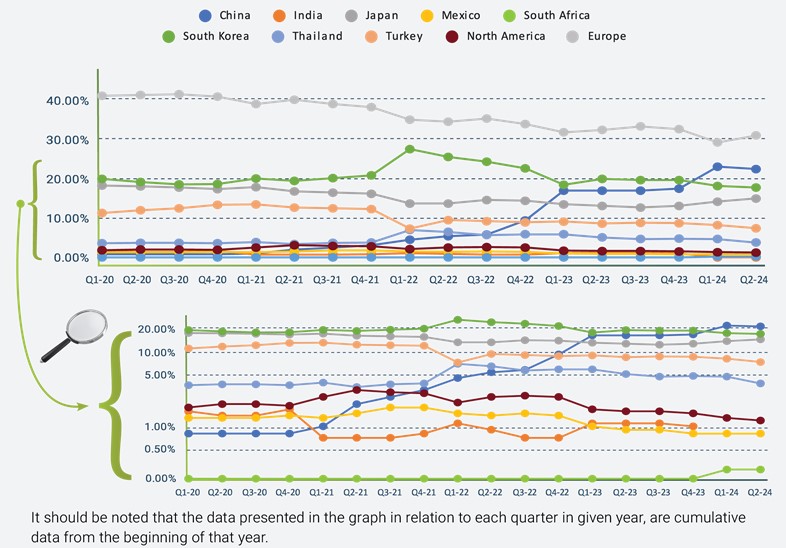
European vehicles: Although still leading, the market share for European vehicles showed signs of recovery to 31.1% in Q2 2024, up from 29.3% in Q1 2024. However, this figure still represents a decrease from 32.5% in Q2 2023 and a more significant drop from 34.6% in Q2 2022, indicating a trend of gradual decline over the past two years.
Chinese vehicles: Chinese vehicles maintained strong momentum, capturing 22.5% of the market in Q2 2024, slightly down from 23.1% in Q1 2024. Nevertheless, this marks substantial growth from 17% in Q2 2023 and a significant leap from 5.4% in Q2 2022, reflecting rapid expansion and increasing acceptance in the Israeli market.
South Korean vehicles: The presence of South Korean vehicles declined slightly to 17.8% in Q2 2024, from 18.2% in Q1 2024. This continues the downward trend from 20% in Q2 2023 and 25.6% in Q2 2022, suggesting some softening in their market dominance.
In Q2 2024, Japanese vehicles continued their upward trend, reaching a 15% market share, up consistently since Q2 2022, highlighting increased consumer favorability. Conversely, Turkish vehicles dropped to 7.4%, extending a downward trend from a higher mark in Q2 2022, signaling diminishing popularity.
